latex for Hasse diagram of poset not properly laid out
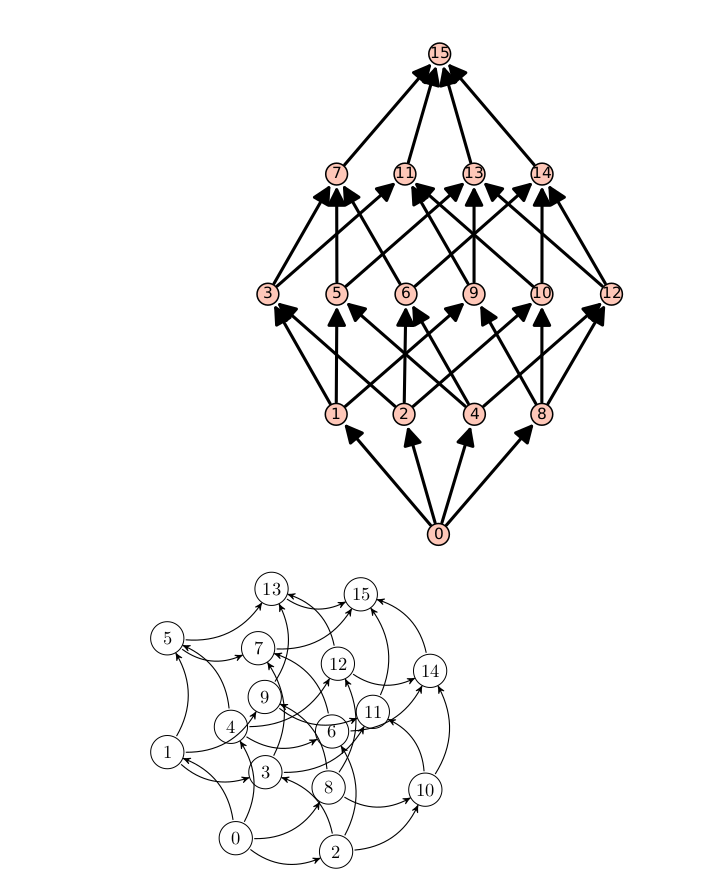
The plot method on a poset displays the Hasse diagram in a satisfying way, with smaller elements below larger ones, as in this example:
B = Posets.BooleanLattice(4,use_subsets=False)
B.plot().save("B4.pdf")
On the other hand,
latex(B)
produces
\begin{tikzpicture}
\definecolor{cv0}{rgb}{0.0,0.0,0.0}

 a bunch of omitted stuff


\Edge[lw=0.1cm,style={post, bend right,color=cv12v14,},](v12)(v14)
\Edge[lw=0.1cm,style={post, bend right,color=cv13v15,},](v13)(v15)
\Edge[lw=0.1cm,style={post, bend right,color=cv14v15,},](v14)(v15)
%
\end{tikzpicture}
The resulting images are attached. The plot() version is above, the latex one is below. The latex version is certainly the correct digraph, but it is not laid out with larger elements above smaller ones. Why is that?C:\fakepath\B4Hasse.png
Edit: I tried the suggestion of FredericC and installed graphivz and dot2tex (in the OS); no change.
I also tried
latex(B.plot())
which produces... some sort of latex
%% Creator: Matplotlib, PGF backend
%%
%% To include the figure in your LaTeX document, write
%%   \input{<filename>.pgf}
%%
when input as directed, the resulting diagram is identical to what plot() shows in a notebook, and what plot().save() produces. The only problem is that the output is extremely long. It is clear why the default method for latexing posets is to use tikz; shame that the layout is buggy.
The best option i found so far is to call Macaulay2 from sage; they produce correct tikz latex Hasse diagrams. One can do
 instr1 = 'needsPackage \"Posets\";'
 instr2 = 'texPoset( booleanLattice 4, SuppressLabels => false)'
 ut1=macaulay2.eval(instr1)
 ut2=macaulay2.eval(instr2)
This is a bit of a kludge, though.

try after installing graphviz and dot2tex
and use then
view(B)to get the tikz code, one can use
view(B, debug=True)I believe that Sage will not detect a system version of
dot2tex: you have to install it via Sage. (graphvizwill come from the OS, as you have already done.) Runningmake dot2texshould work.Or maybe faster:
./sage --pip install dot2tex.