Setting zmin and zmax to get a chosen z-range
Missing functionality
Inspecting the plot method of hyperplanes arrangement reveals
this is not implemented in Sage yet.
Searching Ask Sage and sage-support, we find that many 3d plotting
functions similarly lack the ability to limit the z-range. Providing this
missing functionality is now tracked at
Workaround
Some of the questions on this theme were answered with a suggestion
to use implicit_plot3d. For hyperplanes, this works very well.
We can therefore mimic the plot method of hyperplane arrangements
and cook up a function which, if given only an x-range and a y-range,
will simply call the plot method (which adapts the z-range to the
full range of z values corresponding to the x-range and y-range), but
if additionally given a z-range, will use implicit plots to limit the z-range.
Here is such a function:
def ha_plot(A, ranges, **opt):
    r"""
    Return a plot of this hyperplane arrangement.

    INPUT:

    - ``A`` -- a hyperplane arrangement

    - ``ranges`` -- a list consisting of an x-range, a y-range,
      and optionally a z-range
    """
    from colorsys import hsv_to_rgb
    if len(ranges) == 2:
        return A.plot(ranges=ranges, **opt)
    elif len(ranges) != 3:
        raise ValueError("ranges should consist in two or three tuples")
    hh = [h.coefficients() for h in A.hyperplanes()]
    N = len(hh)
    HSV_tuples = [(i*1.0/N, 0.8, 0.9) for i in range(N)]
    cols = [hsv_to_rgb(*x) for x in HSV_tuples]
    ff = lambda a, b, c, d: lambda x, y, z: d + a*x + b*y + c*z
    ip = lambda f, col: implicit_plot3d(f, *ranges, color=col, **opt)
    hp = lambda a, b, c, d, col: ip(ff(a, b, c, d), col)
    return sum(hp(a, b, c, d, col) for (d, a, b, c), col in zip(hh, cols))
Usage is as follows.
One can provide only an x-range and a y-range:
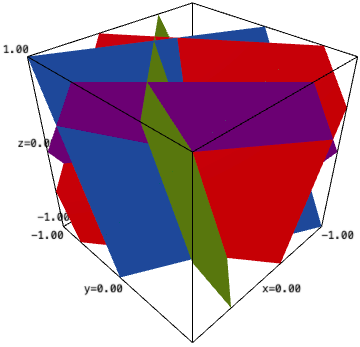
sage: ha_plot(A, [(-1, 1), (-1, 1)]).show(aspect_ratio=(1, 1, 0.25))
and get the exact same picture as in the question.
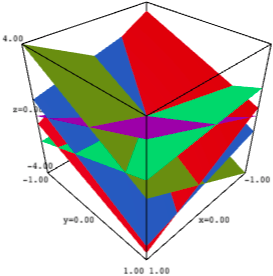
Or one can additionally provide a z-range:
sage: ha_plot(A, [(-1, 1), (-1, 1), (-1, 1)]).show(aspect_ratio=1)
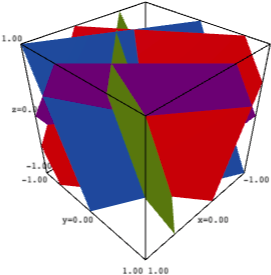
Optional extra arguments are passed to implicit_plot3d.
This for instance allows to set the opacity:
sage: ha_plot(A, [(-1, 1), (-1, 1), (-1, 1)], opacity=0.5).show(aspect_ratio=1)
The function could be improved to accept a choice of colours. Currently
it uses the same default as the plot method of hyperplane arrangements.
Solution using the add_condition method of 3D plots
Added on 2021-08-01, inspired by @FrédéricC's answer to:
One could alternatively use the add_condition method of 3D graphics objects.
One needs to pay attention to the fact that the plot of a hyperplane arrangement
is in fact the sum of the graphs of the individual hyperplanes.
The add_condition method applies to each of those, rather than to their sum.
Define the hyperplane arrangement and name its plot:
H3.<x, y, z> = HyperplaneArrangements(QQ)
A = H3([(1, 2, 1), 0],
       [(-4, -3, -2), 0],
       [(3, 3, -2), 0],
       [(1, -4, 3), 0],
       [(-2, 2, 1), 0])
a = A.plot(ranges=[(-1, 1), (-1, 1)], aspect_ratio=(1, 1, 0.25))
Define bounds and sum the reworked plots
of individual arrangements truncated using add_condition:
z_bounds = lambda x, y, z: -1 < z < 1
aa = sum(h.add_condition(z_bounds) for h in a.all)
Show the result:
aa