Hello, @holistone! I am not 100% sure about the reason for this mutilated arrows, but your conjecture that it could be due to the limits for the vertices and edges being different seems correct; at least there is evidence of that (more on that below).
The easiest way to solve your problem is to use the xmin, xmax, ymin and ymax arguments for the show() method. In your particular case, I can see the positions of your vertices are set by the vpos dictionary, which effectively sets the plotting intervals to be $[-0.5,0.5]$ for the $x$-axis and $[0,0.5]$ for the $y$-axis. Thus, we are going to use slightly bigger intervals (for example, $[-0.6,0.6]$ for the $x$-axis and $[-0.1,0.6]$ for the $y$-axis), as in the following code:
vpos = {'W':(-0.5,0.5),'E':(0.5,0.5),'mW':(-0.5,0),'mE':(0.5,0)}
D1 = DiGraph()
D1.add_edge(('mW','mE','mE-mW'))
D1.add_edge(('W','E','W-E'))
D1.add_edge(('mW','W'))
D1.show(pos=vpos,vertex_size=500,figsize=(2,2), xmin=-0.6, xmax=0.6, ymin=-0.1, ymax=0.6)
This is the result:
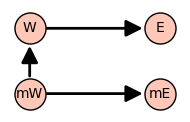
Of course, you can play around with those parameters in order to adjust the layout to your predilection.
Just a side note: In some cases, it seems to be a good choice to add a 10% of the total width to the left and the right, and a 10% of the total height to the top and the bottom of the plot.
Now, this is why I believe that your hypothesis about the mutilated edges is true: If you try to replace the last line of the previous code with
D1.show(pos=vpos,vertex_size=500,figsize=(2,2), xmin=-0.4, xmax=0.4, ymin=0.1, ymax=0.4)
which is a way to small plotting area, you get the following image:
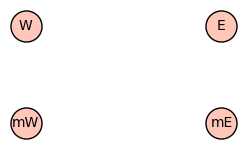
As you can see, your hypothesis correctly predicts that the vertices are indeed displayed (despite of being too few alloted space), but the edges disappeared because there is not enough "area" to plot them.
I hope this helps!


