Ask Your Question
2

Eliminate truncated graph display with large vertices

asked 2020-11-19 06:04:49 +0200

holistone gravatar image

updated 2020-11-19 17:14:50 +0200

When I increase the vertex size (to allow more room for labels) on Graph plots, the boundary vertices are trimmed. Here's an example:

Kms = [(3, 4, 2), (3, 7, 5)]
T = Graph()
T.add_edges(Kms)
T.show(layout='tree',tree_root=3,tree_orientation='down',figsize=(2,1.5))
T.show(layout='tree',tree_root=3,tree_orientation='down',figsize=(2,1.5),vertex_size=800)

image description

Changing figsize does not solve the problem. How do increase the trim limits so that everything drawn is shown?

edit retag flag offensive close merge delete

1 Answer

Sort by ยป oldest newest most voted
4

answered 2020-11-19 07:40:19 +0200

tmonteil gravatar image

updated 2020-11-20 17:16:16 +0200

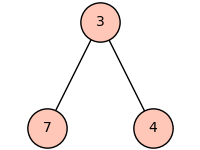
Apparently, the tightness of the graph plot is not well computed. You can set fig_tight option to False:

T.show(layout='tree',tree_root=3,tree_orientation='down',figsize=(2,1.5),vertex_size=800, fig_tight=False)

no tight

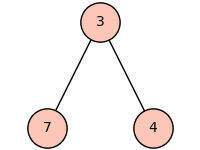
As you can see if you download the image, the tight box background is white while the rest is transparent, so if you need to use the image in another context, you can also set the transparent to True

T.show(layout='tree',tree_root=3,tree_orientation='down',figsize=(2,1.5),vertex_size=800, fig_tight=False, transparent=True)

transparent

EDIT Let me provide some more information, here is how i could find the options you were looking for:

First, you should notice that the show method does not return anything, but performs the action of displaying the plot of the graph:

sage: a = T.show(layout='tree',tree_root=3,tree_orientation='down',figsize=(2,1.5))                                                                                                                          Launched png viewer for Graphics object consisting of 6 graphics primitives 
sage: type(a) 
<class 'NoneType'> 
sage: a is None 
True

The documentation of this method for graphs is only about the tools that could display the graph, namely, the available viewers, see:

sage: T.show?

The plot method however does return the plot of the graph (as a Python object):

sage: b = T.plot(layout='tree',tree_root=3,tree_orientation='down',figsize=(2,1.5)) 
sage: type(b) 
<class 'sage.plot.graphics.Graphics'>

If we look at its documentation, the options we will get are about how to transform the graph into a graphics object (layout, colors, labels, ...):

sage: T.plot?

Now, this Graphics object can be viewed, but as a generic object (compared to a graph), hence its options will provide informations on showing generic pictures, including its precision (dots per inches), its aspect ratio, tightness of the bounding box, transparency, ...:

sage: b.show?

I agree that the various options about plotting are spread among different methods, and that it is pretty annoying.

edit flag offensive delete link more

Comments

2

That works. The fig_tight argument was not in any of the Graph Plotting Options listed in the documentation. Can that be change? or a link added to other options?

I suspect the "tight" bounding box is computed based only on vertex centers, when it should include the vertex size. Even some of the vertices in the set_pos example figure in the documentation are top and bottom truncated. Can the bounding box calculation be updated?

Finally, what are the units for vertex_size (default 200) relative to vertex locations (typically in the range -1.0 - 1.0)?

holistone gravatar imageholistone ( 2020-11-19 17:13:55 +0200 )edit

Your Answer

Please start posting anonymously - your entry will be published after you log in or create a new account.

Add Answer

Question Tools

Stats

Asked: 2020-11-19 06:04:49 +0200

Seen: 228 times

Last updated: Nov 20 '20