Ask Your Question
1

How can I add arbitrary text to a Graph object

asked 2020-11-18 20:11:31 +0200

holistone gravatar image

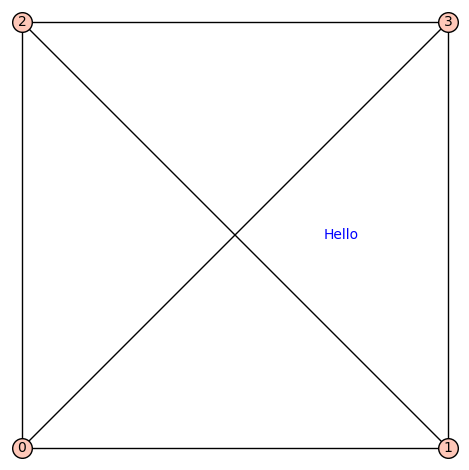
I have created a Graph image such as shown below

image description

using the commands:

D = Graph(E)
D.show(pos=posd,**GPopt)

I would like to add text or a legend (explaining the colors) to the graph, but I have not found a way to add additional text to the Graph object. Suggestions welcome.

edit retag flag offensive close merge delete

Comments

sage: sage.plot.graphics.Graphics.show? tells you that there is the "title" option. And also about "set_legend_options".

FrédéricC gravatar imageFrédéricC ( 2020-11-18 20:19:30 +0200 )edit

Thanks, that's a good pointer. The "title" and title_pos" options allows me to add a single text label. But what if I would like multiple text options? Although .show() recognizes "show legend", Graph does not accept "legend_label". I would expect that there is a general way of adding multiple text to a Graph such as D += text("hello world",(1,1))

holistone gravatar imageholistone ( 2020-11-18 21:38:30 +0200 )edit

Add a node having your text as label, no frame, no edges and manually positioned ?

Emmanuel Charpentier gravatar imageEmmanuel Charpentier ( 2020-11-18 22:38:43 +0200 )edit

The mode would still show as a node with the same format that the other nodes.

holistone gravatar imageholistone ( 2020-11-18 23:15:44 +0200 )edit

2 Answers

Sort by » oldest newest most voted
3

answered 2020-11-18 22:49:23 +0200

rburing gravatar image

updated 2020-11-18 22:51:13 +0200

To add text to a plot, literally add the result of a call to text to the graphics object returned by plot:

sage: G = Graph([(0,1),(0,2),(0,3),(1,2),(1,3),(2,3)])
sage: G.plot(pos={ 0: (0,0), 1 : (1,0), 2: (0,1), 3: (1,1) },axes=False) + text("Hello",(0.75, 0.5))

hello tetrahedron

edit flag offensive delete link more

Comments

1

This works with G.plot() instead of G.show(), and answers my question. Thanks.

holistone gravatar imageholistone ( 2020-11-18 23:19:02 +0200 )edit

You're welcome. You can accept an answer by clicking the ✅

rburing gravatar imagerburing ( 2020-11-19 00:53:29 +0200 )edit
2

answered 2020-11-19 01:32:52 +0200

holistone gravatar image

Thanks to rburing (above) here's a successful example of adding multiple text objects in different colors to a graph: image description

edit flag offensive delete link more

Comments

Nice! You can accept your own answer if it best solves the question. This will mark the question as solved.

slelievre gravatar imageslelievre ( 2021-03-21 00:22:19 +0200 )edit

Your Answer

Please start posting anonymously - your entry will be published after you log in or create a new account.

Add Answer

Question Tools

Stats

Asked: 2020-11-18 20:11:31 +0200

Seen: 1,367 times

Last updated: Nov 19 '20