1) To my knowledge, you can't, since the aspect_ratio option in show has a global effect and overrides any previous setting which can be done. Just draw an ellipse with the right size.
2) It is not clear to me what you mean. Do you want the curve which is strictly symmetric to $y=1/x$ with respect to $y=-10x+10$? Or do you want to plot a curve with the shape of $y=1/x$ but translated to $(1,10)$ and the directions of the axes reversed ($x$-axis pointing to the left, $y$-axis pointing down)? They are two different things. The code below does the second one.
3) The $x$-coordinate is the horizontal one, the $y$-coordinate is the vertical one. Given a function $f$, we usually consider that $x$ is the independent variable and that $y$ is the dependent one. So I interpret your question as follows: how to plot a function $f$ when the independent variable is $y$. If I am right, the answer could be: don't use plot, use parametric_plot or implicit_plot. More specifically, to draw $x=f(y)$, with $y\in[c,d]$, use
parametric_plot((f(y),y), (y,c,d))
or
implicit_plot(x==f(y), (x,a,b), (y,c,d))
for suitable values of $a$ and $b$.
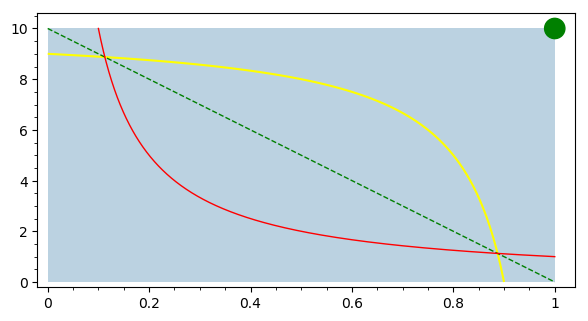
Check this code, which modifies yours:
var("x,y")
x1, x2, y1, y2 = 0, 1, 0, 10
p = polygon([(x1,y1), (x1,y2), (x2,y2), (x2,y1)], color="#bbd2e1")
p += plot(-10*x+10, (x,x1,x2), color="green", linestyle="dashed")

f(x) = 1/x
p += plot(f(x), (x,x1+0.1,x2), color="red")
x0, y0 = 1, 10
p += implicit_plot(f(x0-x)==y0-y, (x,x0-x2,x0-x1), (y,y0-y2,y0-y1), color="yellow")

scale = 0.05
radius = 0.02
p += ellipse((x2,y2), radius, radius/scale, edgecolor="green",
              fill=true, facecolor="green")
show(p, aspect_ratio=scale)
This is the result: