Ask Your Question
2

Sage won't plot more than two planes

asked 2020-03-04 02:42:24 +0200

dsejas gravatar image

updated 2024-01-15 12:03:50 +0200

FrédéricC gravatar image

Hello, Sage community!

I have the following code that shows the solution of a 3x3 system of equations as an interact:

A = matrix(RR, 3, 3, [2,1,1,1,-2,1,1,3,-2] )
var('x y z')

@interact
def sol_3ecu_3inc(k1 = slider(-5, 5, 0.1, -1), k2 = slider(-5, 5, 0.1, -2), k3 = slider(-5, 5, 0.1, -3)):

    bvec = vector(RR, [k1, k2, k3])
    xvec = A \ bvec

    augmented_matrix = A.augment(bvec, subdivide=True)

    RADIUS = 6

    myplot  = implicit_plot3d(2*x + y + z == k1, (x,-RADIUS,RADIUS), (y,-RADIUS,RADIUS), (z,-RADIUS,RADIUS), color='red', opacity=0.1)
    myplot += implicit_plot3d(x - 2*y + z == k2, (x,-RADIUS,RADIUS), (y,-RADIUS,RADIUS), (z,-RADIUS,RADIUS), color='yellow', opacity=0.1)
    myplot += implicit_plot3d(x + 3*y - 2*z == k3, (x,-RADIUS,RADIUS), (y,-RADIUS,RADIUS), (z,-RADIUS,RADIUS), color='blue', opacity=0.1) 
    myplot += point3d((xvec[0], xvec[1], xvec[2]), color='black', size=100)

    myplot += line3d([(-RADIUS,0,0), (+RADIUS,0,0)], thickness=3, color='orange')
    myplot += line3d([(0,-RADIUS,0), (0,+RADIUS,0)], thickness=3, color='orange')
    myplot += line3d([(0,0,-RADIUS), (0,0,+RADIUS)], thickness=3, color='orange')

    show(myplot)

The result should look like this: image description

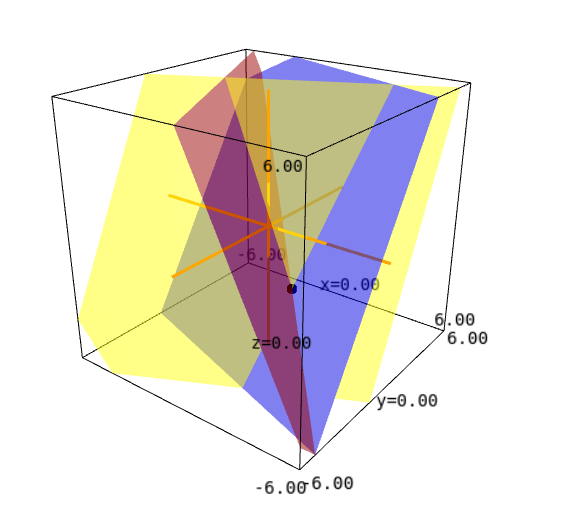
When I run this code in CoCalc or my own SageMath local installation, it works perfectly. However, if I try to execute this in sagecell.sagemath.org, Sage won't be willing to plot this. However, if I delete one the implicit_plot3d commands, the plot magically appears.

Can somebody explain this? Is this reproducible for other users?

edit retag flag offensive close merge delete

2 Answers

Sort by » oldest newest most voted
2

answered 2020-03-04 09:41:40 +0200

Juanjo gravatar image

Concerning the second question, yes, it is reproducible. It seems that SageCell only plots one or two implicit_plot3d. I've been experimenting with this code:

var("x,y,z")
fig = implicit_plot3d(x^2+y+z==0, (x,-1,1), (y,-1,1), (z,-1,1), color="red")
#fig += implicit_plot3d(x-y+z^2==0, (x,-1,1), (y,-1,1), (z,-1,1), color="green")
#fig += implicit_plot3d(x-y^2+z^2==0, (x,-1,1), (y,-1,1), (z,-1,1), color="blue")
show(fig)
print("Finished")

Sometimes I could only plot one surface, sometimes two, but never the three surfaces.

edit flag offensive delete link more

Comments

1

I wonder why this is happening. This is quite strange. Could this be a bug or a problem of SageCell itself?

dsejas gravatar imagedsejas ( 2020-03-04 17:21:43 +0200 )edit
0

answered 2024-01-16 18:26:00 +0200

Emmanuel Charpentier gravatar image

This now (2024_01-16) works, up to a couple of warnings bound to an obsolete syntax :

/tmp/ipykernel_1827424/2401846451.py:8: DeprecationWarning: the backslash operator has been deprecated
See https://github.com/sagemath/sage/issues/36394 for details.
  xvec = A  * BackslashOperator() * bvec
/tmp/ipykernel_1827424/2401846451.py:8: DeprecationWarning: the backslash operator has been deprecated; use A.solve_right(B) instead
See https://github.com/sagemath/sage/issues/36394 for details.
  xvec = A  * BackslashOperator() * bvec
edit flag offensive delete link more

Your Answer

Please start posting anonymously - your entry will be published after you log in or create a new account.

Add Answer

Question Tools

1 follower

Stats

Asked: 2020-03-04 02:42:24 +0200

Seen: 385 times

Last updated: Jan 16