Plot points in loglog
Hi I'm trying to plot a function with loglog scaling. However the result seems to have very few plot points. I'm using Sage 8.7 on Windows.

Is this a bug or am I doing something wrong?
Cheers!
Hi I'm trying to plot a function with loglog scaling. However the result seems to have very few plot points. I'm using Sage 8.7 on Windows.
Is this a bug or am I doing something wrong?
Cheers!
It would seem plots in log scale use a sampling done in the non-log scale...
Since plots only 200 plot points by default, the sampling in non-log scale means that for a log-scale plot, most plot points are near the end, and they are very scarce in the first 3/4 of the plot.
A workaround, as suggested in @Iguananaut's answer, is to use more plot points.
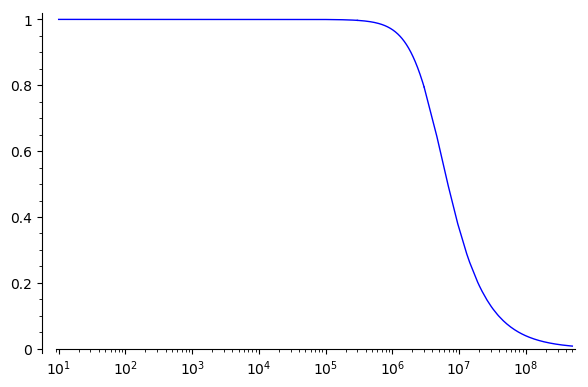
Using 800 plot points already gives a much smoother curve here:
sage: tau = RDF.pi()*2
sage: out2 = lambda r, c: lambda f: ~(1 + (tau*f*r*c)^2)
sage: plot(out2(15, 2.7e-9), (10, 500e6), scale='loglog', plot_points=800)
Launched png viewer for Graphics object consisting of 1 graphics primitive
There was a problem I thought looked similar: the x-range and y-range for a plot are chosen slightly wider than the actual range of x-values and y-values that occur in the plot, and sometimes in log scale it looks like this "slightly wider" is chosen in non-log scale, giving a wrong aspect. See
Yes, I tried displaying the plot points with plot(out(15, 2.7e-9)^2, (10, 500e6), scale='loglog', markers="+") and there are lots of points in the section > 10^7 suggesting the selection of points is done in non-log scale. I think this is really confusing and probably should be fixed in a future release. Marked as answer, because of this. But thanks to @Iguananaut for the workaround!
"It would seem plots in log scale use a sampling done in the non-log scale..." I wondered if that might be the case myself. If so, should we open a ticket for this? Seems buggy to me.
This should definitely be fixed. Maybe as part of
I was able to obtain a reasonably nice plot with:
plot(out(15, 2.7e-9), (10, 500e6), scale='semilogx', plot_points=2000)

Another way you could do it is break it up into multiple plots, with one plot adding more points just around the inflection point, like:
f_0 = out(15, 2.7e-9)
P = plot(f_0, (10, 3e5), scale='semilogx') # Just eyeballing it
P += plot(f_0, (3e5, 3e6), scale='semilogx')
P += plot(f_0, (3e6, 5e8))
P
which looks a tiny bit smoother.
Regardless, it could be nice if the automatic interpolation were better in this case. It's possible some other parameters could be adjusted to improve it but I'm not sure.
I'll also add that since most of that initial level part is not very interesting you might also consider just cropping the plot by having the x-axis start around 10e4, 10e5 or so...
Please start posting anonymously - your entry will be published after you log in or create a new account.
Asked: 2019-05-10 12:32:54 +0200
Seen: 501 times
Last updated: May 12 '19
 Copyright Sage, 2010. Some rights reserved under creative commons license. Content on this site is licensed under a Creative Commons Attribution Share Alike 3.0 license.
I don't know an immediate answer off the top of my head, but it looks like it has to do with how the plotted points are being sampled. For whatever reason it's not finding your inflection point and adding extra points around it to make it look smoother; instead you just get this sharp inflection. BTW, it would help if you posted the text of your code in the question so it can easily be copy/pasted.