Ask Your Question
1

Restriction of domain of vector field

asked 2018-11-06 21:04:40 +0200

Michał_Fabisiak gravatar image

updated 2018-11-06 21:21:01 +0200

tmonteil gravatar image

I was trying to plot a field of normal vectors to a given implicit graph. What I got so far is:
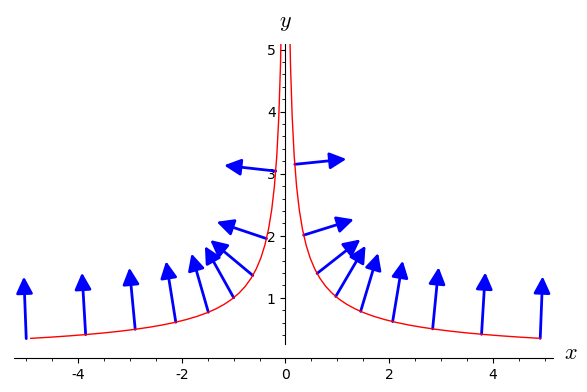
x, y = var('x y')
f(x,y) = 2*x*y^3
g(x,y) = x^2*3*y^2
d = plot_vector_field((f(x,y)/sqrt(f(x,y)^2+g(x,y)^2),g(x,y)/sqrt(f(x,y)^2+g(x,y)^2)), (x,-5,5), (y,-5,5))
s = implicit_plot(x^2*y^3-1 , (x,-5,5), (y,-5,5))
show(s+d)

And it works like a charm, however, is there a way to "restrict" a domain of plot_vector_field so it doesn't plot all the vectors in a given range, but only for point (x,y) lying on my graph? That is such points that x^2*y^3=1. I tried to just put it instead (y,-5,5) (in a y=(1/x^2)^(1/3) form), but it obviously doesn't work. Thx for any help as I'm new to Sage.

edit retag flag offensive close merge delete

1 Answer

Sort by » oldest newest most voted
2

answered 2018-11-07 08:14:12 +0200

eric_g gravatar image

updated 2018-11-07 08:24:28 +0200

A solution is to transform the implicit graph into a curve and to use the method along of vector fields:

E.<x,y> = EuclideanSpace()
f(x,y) = 2*x*y^3
g(x,y) = x^2*3*y^2
v = E.vector_field([f(x,y)/sqrt(f(x,y)^2+g(x,y)^2),
                    g(x,y)/sqrt(f(x,y)^2+g(x,y)^2)])
t = var('t')
S = E.curve([t^3, t^(-2)], t)
vS = v.along(S)
graph = S.plot(prange=(-1.7, 1.7))
graph += vS.plot(E.cartesian_coordinates(), ranges={t: (-1.71, 1.7)},
                 number_values=25)
show(graph, ymax=5)

image description

See this page for help/tutorials on vector fields with Sage.

edit flag offensive delete link more

Comments

Thanks for your help!

Michał_Fabisiak gravatar imageMichał_Fabisiak ( 2018-11-08 19:01:11 +0200 )edit

Your Answer

Please start posting anonymously - your entry will be published after you log in or create a new account.

Add Answer

Question Tools

Stats

Asked: 2018-11-06 21:04:40 +0200

Seen: 430 times

Last updated: Nov 07 '18