Ask Your Question
0

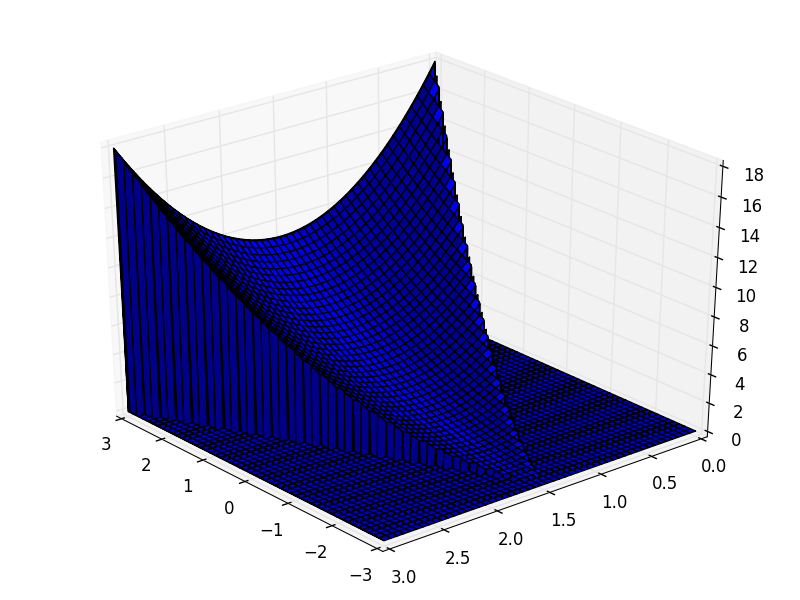
How can we plot the region bounded by f(x,y)=x^2+y^2, x varies from -y to y and y varies from 0 to 3

asked 2016-09-13 10:38:24 +0200

this post is marked as community wiki

This post is a wiki. Anyone with karma >750 is welcome to improve it.

I am goind to find out the double integral to integrate x^2+y^2 and x varies from - y to y and y from 0 to 3. I want to know how to plot this using sage math?

edit retag flag offensive close merge delete

1 Answer

Sort by ยป oldest newest most voted
1

answered 2016-09-15 11:02:57 +0200

Eugene gravatar image

I would also like to know true-sage approach, just in case here is a clumsy approach with loops and matplotlib:

import numpy as np

import matplotlib
import matplotlib.pyplot as plt

from matplotlib.pyplot import figure
from mpl_toolkits.mplot3d import axes3d

# Define

def f(x, y):
    if not (-y <= x <= y):
        return 0
    else:
        return x ** 2 + y ** 2

# Calculate

N = 512

y = np.linspace(0, 3, N)
x = np.linspace(-3, 3, N)

z = np.zeros((N, N))

for i, _x in enumerate(x):
    for j, _y in enumerate(y):
        z[i, j] = f(_x, _y)

# Plot

fig = plt.figure()
ax = fig.gca(projection='3d')
ax.view_init(azim=140)
X, Y = np.meshgrid(x, y)
ax.plot_surface(X, Y, z)
plt.tight_layout()
plt.savefig('sage0.png')
plt.close()

image description

edit flag offensive delete link more

Your Answer

Please start posting anonymously - your entry will be published after you log in or create a new account.

Add Answer

Question Tools

1 follower

Stats

Asked: 2016-09-13 10:38:24 +0200

Seen: 417 times

Last updated: Sep 15 '16