Ask Your Question
1

Plotting LabelledOrderedTrees in Knuth style

asked 2016-08-29 15:04:40 +0200

Peter Luschny gravatar image

Consider the tree

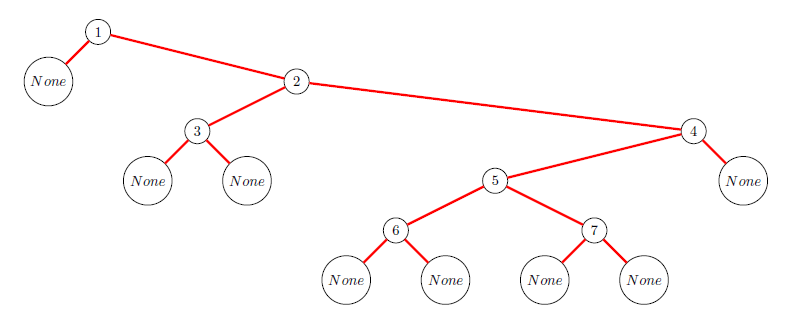
t = Permutation([1,3,2,6,5,7,4]).increasing_tree().as_ordered_tree()

A nice simple plot is given by

ascii_art(t)


  _________1___________
 /                    /
None      ___________2_____________
         /                        /
       _3___               ______4_______
      /    /              /             /
     None None       ____5______       None
                    /          /
                  _6___      _7___
                 /    /     /    /
                None None  None None

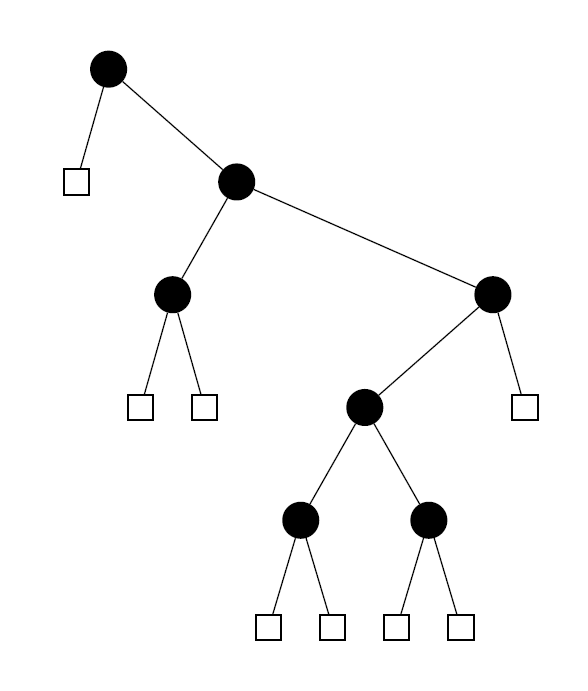
What I need is a graph-plot in exactly this layout in Knuth style (cf. the tables in 7.2.1.6) where the inner nodes (above labeled by numbers) are filled black disks and the leaves (above labeld by 'None') are empty squares.

How can I achieve this?

edit retag flag offensive close merge delete

Comments

There is now also "unicode_art" (not answering the question).

FrédéricC gravatar imageFrédéricC ( 2016-08-29 18:39:14 +0200 )edit

Frédéric, in my jupyter notebook I see no difference although I expected one after looking into abstract_tree.py. What are the requirements?

Peter Luschny gravatar imagePeter Luschny ( 2016-08-30 08:01:51 +0200 )edit

Ah, I see now, it works with 7.3 (but did not with 7.2). But it does not work with LabelledBinaryTrees. With t = Permutation([1,3,2,6,5,7,4]).increasing_tree() I get the AttributeError 'UnicodeArt' object has no attribute '_root'.

Peter Luschny gravatar imagePeter Luschny ( 2016-08-30 14:38:45 +0200 )edit

not yet implemented for binary trees, indeed

FrédéricC gravatar imageFrédéricC ( 2016-08-31 19:06:07 +0200 )edit

Maybe you could use "t.map_labels(lambda x: 0 if x in ZZ else 1)" to avoid part of the post-processing.

FrédéricC gravatar imageFrédéricC ( 2016-09-01 18:47:56 +0200 )edit

1 Answer

Sort by » oldest newest most voted
0

answered 2016-08-30 09:24:55 +0200

Peter Luschny gravatar image

updated 2016-08-30 09:44:41 +0200

This is not an answer but a workaround in the case that one wishes a standalone picture.

Instead of ascii_art(t) execute pretty_print(t). Then edit the TeX code like this:

  • Replace commands of the type

    \newcommand{\nodec}{\node[draw,circle] (c) {\$None\$} by

    \newcommand{\nodeb}{\node[draw,rectangle] (c) {$$}

  • Replace commands of the type

    \newcommand{\nodei}{\node[draw,circle] (i) {\$6\$} by

    \newcommand{\nodei}{\node[fill=black,draw,circle] (i) {$$}

  • Replace

    \matrix[column sep=.3cm, row sep=.3cm,ampersand replacement=\&] by

    \matrix[row sep=0.7cm,ampersand replacement=\&]

  • Replace

    \path[ultra thick, red] by

    \path[black]

This will replace the tree in Sage style

image description

by a tree in Knuth style:

image description

I really would like to see this as the default style for binary trees.

edit flag offensive delete link more

Your Answer

Please start posting anonymously - your entry will be published after you log in or create a new account.

Add Answer

Question Tools

1 follower

Stats

Asked: 2016-08-29 15:04:40 +0200

Seen: 1,810 times

Last updated: Aug 30 '16