Ask Your Question
0

Plotting 3D points in a certain way

asked 2015-07-08 20:15:31 +0200

Ozera gravatar image

I wish to recreate this sort of plot: http://i.imgur.com/19UPf5D.png i.e, plot 3d points in the xyz plane and connect the points by a line.

Does anyone know how to do that?

I found: http://doc.sagemath.org/html/en/refer... but I haven't been able to find exactly what I want.

edit retag flag offensive close merge delete

1 Answer

Sort by ยป oldest newest most voted
1

answered 2015-07-08 20:45:19 +0200

fidbc gravatar image

updated 2015-07-09 06:04:55 +0200

Maybe you can try something of the form

# list of points
pts = [(0, 0, 0), (1, 0, 0), (1, 1, 0), (1, 1, 1), (2, 1, 1), (2, 2, 1), (2, 2, 2), (3, 2, 2), (3, 3, 2), (3, 3, 3), (4, 3, 3), (4, 4, 3), (4, 4, 4), (5, 4, 4), (5, 5, 4), (5, 5, 5), (6, 5, 5), (6, 6, 5), (6, 6, 6), (7, 6, 6), (7, 7, 6)]

# some red segments
red_segments = [[pts[i],pts[i+1]] for i in range(len(pts)-1) if i%3==0]
# some green segments
green_segments = [[pts[i],pts[i+1]] for i in range(len(pts)-1) if i%3==1]
# some blue segments
blue_segments = [[pts[i],pts[i+1]] for i in range(len(pts)-1) if i%3==2]

# empty graphics object
P=Graphics()

for rs in red_segments:
    P += line3d(rs,color='red')
for gs in green_segments:
    P += line3d(gs,color='green')
for bs in blue_segments:
    P += line3d(bs,color='blue')

P+=point3d(pts,color='black')
P

Sample output: image description

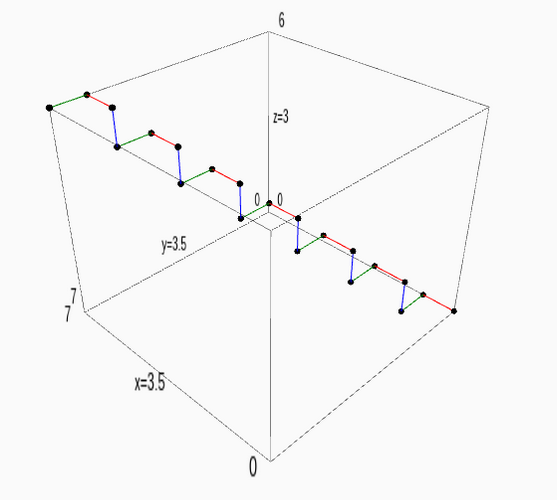
Update: Removed bug on 2nd line of code and added a last line (curiously P.show()does not actually show the plot in cloud.sagemath.com).

edit flag offensive delete link more

Comments

Hi fidbc, I attempted to run your code, but encountered errors. In what environment did you run this in? Error (This is Ozera, but the Ozera account wouldn't let me post a comment)

Nomly gravatar imageNomly ( 2015-07-09 00:25:04 +0200 )edit

Sorry @Ozera, @Nomly. My code had a bug but I think it works now. I'm running this code in cloud.sagemath.com

fidbc gravatar imagefidbc ( 2015-07-09 05:52:51 +0200 )edit

@fidbc How odd. Do you know why replacing it with simply 'P' is the solution. In the documentation I read, it was always using the show() function. Also, is there a way to remove the bounding box? I'm not sure where the frame=False argument would go.

Nomly gravatar imageNomly ( 2015-07-09 06:39:59 +0200 )edit

@Nomly It seems that show(P,frame=False) works fine. Maybe this is a bug, I'll ask in the sage-support group.

fidbc gravatar imagefidbc ( 2015-07-09 19:25:16 +0200 )edit
fidbc gravatar imagefidbc ( 2015-07-10 13:57:45 +0200 )edit

Your Answer

Please start posting anonymously - your entry will be published after you log in or create a new account.

Add Answer

Question Tools

Stats

Asked: 2015-07-08 20:15:31 +0200

Seen: 2,163 times

Last updated: Jul 09 '15