Revision history [back]
| | 1 | initial version |

The code below completes your code, as well as that by @dsejas, adding a label to the plot. It also shows an alternative way of extracting the solutions $x(t)$ and $y(t)$ in order to define $f(t)$ and $g(t)$. Concerning the legend, I have deliberately used many customization options, just for the purpose of illustrating them. For a complete list of options, first evaluate the code, then type p.set_legend_options?.
t = var('t')
x = function('x')(t)
y = function('y')(t)
de1 = diff(x,t) == -3/20*x + 1/12*y
de2 = diff(y,t) == 3/20*x-3/20*y
sol = desolve_system([de1,de2],[x,y],ics=[0,4,0])
f(t) = x(t).subs(sol)
g(t) = y(t).subs(sol)
p = plot(f, (t, 0, 10), color='red', legend_label="de1")
p += plot(g, (t, 0, 10), color='blue', legend_label="de2")
legend_op = dict(loc=1, handlelength=3, handletextpad=0.5,
labelspacing=0.6, borderpad=0.8, title="Solutions",
back_color=(0.85,0.95,0.85), fancybox=True,
font_family="serif", font_style="italic")
p.set_legend_options(**legend_op)
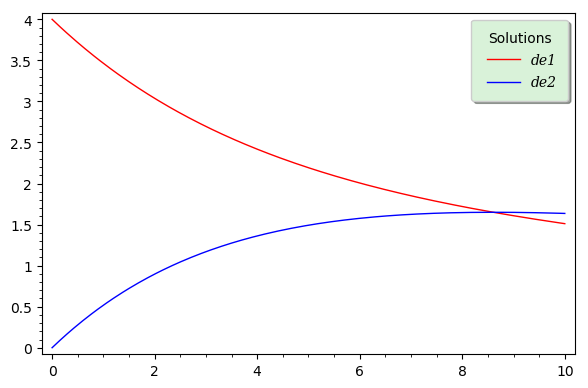
p.show(frame=True, axes=False)
This is the result: